


Financial markets are filled with technical indicators that help traders and investors analyze price movements. One of the most widely discussed bearish signals is the Death Cross. Whenever this pattern appears on a stock, index, or cryptocurrency chart, it often attracts significant attention because it may indicate weakening market momentum.
However, while the Death Cross has a reputation for signaling potential downturns, it is not a guarantee that prices will continue to fall. Understanding how this indicator works, its strengths, and its limitations can help investors make more informed decisions.
What Is a Death Cross?
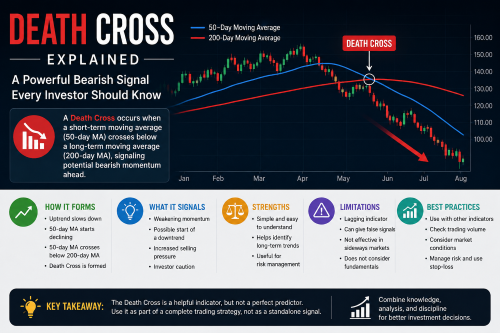
A Death Cross is a technical chart pattern that occurs when a shorter-term moving average crosses below a longer-term moving average. The most commonly used combination is the 50-day moving average crossing below the 200-day moving average.
The pattern suggests that recent price performance has weakened compared to the longer-term trend, which some traders interpret as a sign of increasing bearish momentum.
Although the Death Cross is most commonly associated with stocks, it can also appear in:
- Stock market indices
- Exchange-traded funds (ETFs)
- Commodities
- Forex markets
- Cryptocurrencies
Because it relies on historical price data, the Death Cross is considered a lagging indicator, meaning it reflects market trends that have already begun rather than predicting future price movements.
How Does a Death Cross Form?
The formation of a Death Cross generally occurs in three stages.
1. Uptrend Begins to Slow
Initially, an asset experiences a strong upward trend. Over time, buying momentum weakens, and prices begin moving sideways or lower.
2. Moving Averages Converge
As prices continue to soften, the short-term moving average gradually declines toward the long-term moving average.
3. Bearish Crossover
When the 50-day moving average falls below the 200-day moving average, the Death Cross is officially formed. Many traders view this crossover as confirmation of a weakening market trend.
Why Is the Death Cross Important?
The Death Cross is popular because it provides a simple way to identify potential trend changes.
Some reasons traders monitor this pattern include:
- Identifying possible long-term bearish trends
- Managing investment risk
- Adjusting portfolio allocations
- Planning entry and exit points
- Confirming other technical indicators
Institutional investors, portfolio managers, and technical analysts often consider the Death Cross alongside broader market conditions rather than relying on it alone.
Death Cross vs. Golden Cross
The Death Cross has an opposite pattern known as the Golden Cross.
| Death Cross | Golden Cross |
|---|---|
| Indicates potential bearish momentum | Indicates potential bullish momentum |
| 50-day MA crosses below 200-day MA | 50-day MA crosses above 200-day MA |
| Often follows weakening prices | Often follows strengthening prices |
| May signal increased selling pressure | May signal renewed buying interest |
While both patterns are widely followed, neither guarantees future market performance.
Advantages of Using the Death Cross
Easy to Understand
The Death Cross is straightforward and can be identified on most charting platforms without advanced technical knowledge.
Helps Identify Long-Term Trends
Unlike short-term price fluctuations, this indicator focuses on broader market direction.
Useful for Risk Management
Some investors use the Death Cross as one factor when reviewing portfolio risk or considering defensive investment strategies.
Widely Recognized
Since many market participants monitor this pattern, it can sometimes influence market sentiment and trading behavior.
Limitations of the Death Cross
Despite its popularity, the Death Cross has several important drawbacks.
It Is a Lagging Indicator
Because moving averages are based on historical prices, the crossover often occurs after a significant decline has already taken place.
False Signals
Markets occasionally recover shortly after a Death Cross appears, creating what traders call a “false signal.”
Doesn’t Explain Why Prices Are Falling
The indicator only reflects price movements. It does not account for company earnings, economic conditions, interest rates, or geopolitical events.
Less Effective in Sideways Markets
During periods of low volatility, moving averages may cross frequently without producing meaningful trends.
How Traders Use the Death Cross
Professional traders rarely rely on a single indicator. Instead, they combine the Death Cross with additional analysis.
Common supporting tools include:
- Trading volume
- Relative Strength Index (RSI)
- MACD (Moving Average Convergence Divergence)
- Support and resistance levels
- Trendlines
- Economic news
- Company fundamentals
Using multiple indicators can help reduce the likelihood of acting on false signals.
Death Cross in Different Markets
Stock Market
Investors watch for Death Cross patterns in individual stocks as well as major indices such as the S&P 500 or Nifty 50 to gauge broader market sentiment.
Cryptocurrency
Bitcoin and other cryptocurrencies frequently experience Death Cross formations due to their high volatility. While the signal may attract attention, crypto markets can reverse quickly.
Commodities
Gold, silver, crude oil, and agricultural commodities may also form Death Cross patterns during prolonged price declines.
Forex
Currency traders sometimes use moving average crossovers to identify longer-term trends in major currency pairs.
Should Investors Sell After a Death Cross?
Not necessarily.
A Death Cross should not automatically trigger a sell decision. Instead, investors may consider several questions:
- Has the company’s financial outlook changed?
- Are broader economic conditions weakening?
- Does the asset still align with long-term investment goals?
- Are other technical indicators confirming the bearish trend?
Long-term investors often focus more on business fundamentals than on a single technical pattern.
Practical Tips for Using the Death Cross
If you choose to include the Death Cross in your market analysis, consider these best practices:
- Combine it with other technical indicators.
- Pay attention to trading volume during the crossover.
- Avoid making decisions based on one signal alone.
- Consider the broader market environment.
- Use stop-loss strategies if appropriate for your trading plan.
- Maintain a diversified investment portfolio to help manage risk.
Common Misconceptions
Several myths surround the Death Cross.
Myth: Every Death Cross leads to a market crash.
Reality: Many do not. Some markets recover quickly after the crossover.
Myth: The Death Cross predicts the future.
Reality: It reflects historical price data and confirms existing trends rather than forecasting new ones.
Myth: It works equally well in every market.
Reality: Its reliability varies depending on market conditions and asset volatility.
Conclusion
The Death Cross is one of the most recognized technical indicators in financial markets. Formed when the 50-day moving average falls below the 200-day moving average, it often signals weakening long-term momentum and attracts the attention of traders and investors alike.
However, no technical indicator is perfect. The Death Cross is best viewed as one piece of a broader analytical framework that includes technical analysis, market sentiment, economic conditions, and fundamental research. By understanding both its strengths and limitations, investors can use this indicator more effectively and avoid making decisions based solely on a single chart pattern.
Disclaimer: This article is for informational and educational purposes only and should not be considered financial or investment advice. Always conduct your own research or consult a qualified financial advisor before making investment decisions.
Capital Flight: Meaning, Causes, Effects, and Prevention